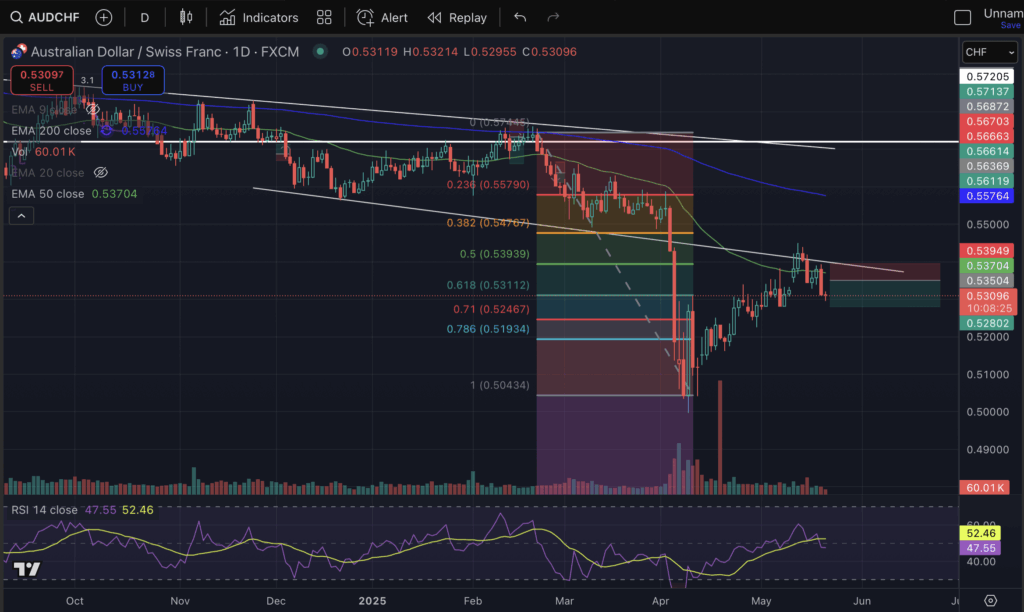
This week I’m focusing on AUD/CHF. I am looking to enter a short. However, I am currently waiting if a retest might happen to a little bit below the EMA50. I order to check if this retest is happening, I will monitor the candle behavior at lower timeframes (4hr and 1 hr)
This chart catches my attention for several reasons. First, the candlestick behavior signals a potential downward movement or trend. Second, the price is currently trading below both the 50-day and 200-day Exponential Moving Averages (EMAs). Third, when zooming out to the three-day chart, a bearish market shift is evident, with the latest bearish candle fully engulfing the previous one.
However, despite these bearish indicators, the downside potential may be limited. The three-day trend could suggest that this is merely a temporary pullback before the price resumes its upward trajectory.
UPDATE (26th of May 2025): I have entered the trade at around (0.53467 CHF).

Leave a Reply