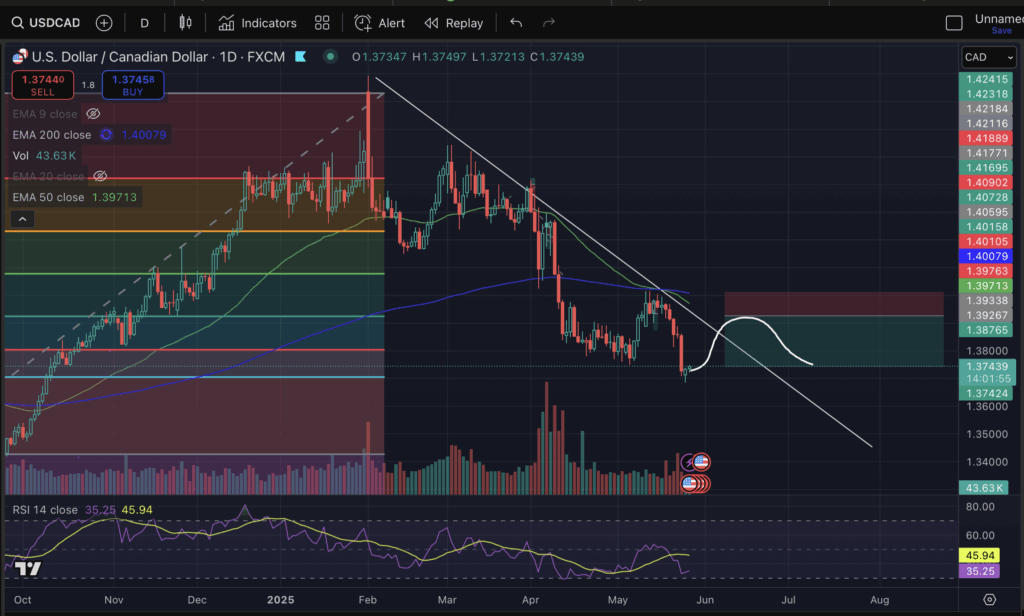
The USD/CAD pair is currently bouncing off the 0.786 Fibonacci level. If this bounce holds, I expect upside movement toward the red (0.71) and possibly the green (0.618) Fibonacci levels. However, zooming out reveals a daily downtrend, confirmed by bearish candle patterns such as lower highs and lower lows.
Since I avoid trading against the daily trend, I will wait to enter a trade until the upside movement is exhausted. To determine when the downturn occurs, I will monitor lower timeframes regularly.
Leave a Reply